“What makes you guys different…?”
Ever hear that question before, or more accurately do you think your customers ask that question of your brand frequently?
Here’s a different, and fun perspective – let’s look at how we can apply data to help position and differentiate a brand, but let’s use my classic rock band as a case study….
I play guitar in a 4 piece classic rock cover band. It’s a hobby, and I love doing it. Given that we are family men, fathers, husbands, and working professionals by day, we like to play out just a couple of times a month. Because we manage ourselves, we have to “get gigs” on our own by selling ourselves to local club managers, bar owners, event planners and managers, and the like. There are lots of guitar players and lots of cover bands out there. Guess which question we get asked often? Yep – “what makes you guys different?”
The Data-Driven Set List
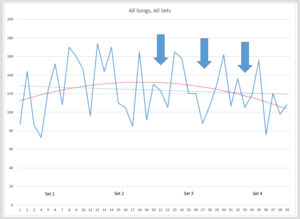
Now, this is a theory of mine, but I’d say that most bands establish a set list based on subjective parameters – gut, experience, favorites, or a moistened finger held up into the wind. I had a thought…If the goal is to get butts out of seats and onto the dance floor for extended periods, how would a band use data to build a set list that teases them into dancing at 9 PM yet leaves everyone exhausted but exhilarated by 2 AM? The answer? Beats Per Minute. Various DJ research has shown that the optimal “dance BPM” is about 120. We took one of our set lists and plotted it, and discovered that we were actually “decelerating” in many cases as the night wore on. In other words, we were playing high BPM songs earlier than maybe we should and also slowing the BPM down in the all-important, later 3rd and 4th sets.
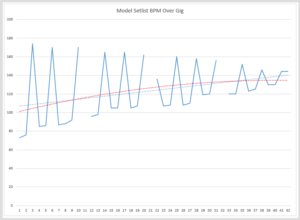
The graphs are shown below.

Graph 2 shows what happened when we gradually built BPM from the 1st to the 4th set, anticipating that by midnight every song would be packing the floor with dancers at an average BPM in the high 120’s.
So how does this make us different? We can show a local club owner or talent agent how our band optimizes the patrons’ experience by ensuring that we deliver a set list designed to engage the audience throughout the event, and not in some random pattern based on nothing. As a result, they should stay later, listen and dance longer, buy more food and drink, and generally have a better experience over a longer period of time.
We use data to refine our set lists in order to help deliver an optimal customer experience.
The Post Gig Survey
How many cover bands use Net Promoter Score style questions to gauge their customer’s satisfaction with the experience?
We printed up some cool band logo stickers (we’re currently working on refrigerator magnets…) and we’ll give them out for free if you leave us your email address in the tip jar. After each gig, we try to send a survey to those patrons that left us an email address (and also the club manager…)
Questions range from song selection to sound mix to stage lighting and production value. We even throw in a standard NPS question about recommending us to friends. We ask about songs that we might consider adding in the future, songs we might consider dropping, and whether the sets were too long, too short, or just right. Some questions are dichotomous scales, some are Likert, and some are open comments. Of course, statistical significance and confidence intervals are a challenge at times, but it is great to get direct customer feedback and actually make material and stage decisions based on the accumulation of feedback over time.
So how does this make us different? We can explain to a local club owner or talent agent how our band surveys patrons about everything from our song selection to our set lighting and sound mix, to ensure that we are delivering against their expectations when we play the venue again – hopefully in the very near future. As a result, patrons should stay later, listen and dance longer, buy more food and drink, and generally have a better experience over a longer period of time.
We use survey data to help understand how to deliver an optimal customer experience.
The Big Enchilada – How does this relate to business?
I’m trying to talk the band into a customer journey mapping session or two, but I risk getting my eye poked out with a drumstick. And I’d love to tell you that we’ve been using this data-driven approach for some time and it is successful, but frankly it is a relatively new approach. We still argue, debate, discuss and disagree about everything from songs to volume to lighting (after all, we’re a band…) At the end of the day (or night,) there is only one KPI that matters – the money in the till after the band gets paid (read: revenue minus expenses.)
I maintain that this approach can provide the band with a competitive edge in obtaining bookings. Yes, there are many other variables to consider – songs (read: content), talent level (read: people), execution level (read: musical experience, education, and repetition) passion and energy (read: culture) and finally, a dedicated fan base (read: brand advocates.) However, given relative parity in the competitive set and marketplace, a data-driven approach to support the overall marketing effort can’t hurt, can it?
Are you using data to deliver an optimal customer experience? Opportunities exist in more places than you might think. Rock on.


